Mon - Fri: 9:00 AM - 6:00 PM

Mon - Fri: 9:00 AM - 6:00 PM

We build smarter digital solutions that simplify operations, connect systems, improve customer experiences, and help your business grow with confidence.
AI AUTOMATION SOLUTIONS
Make informed business decisions using your own data. We set up reporting and modeling workflows to estimate sales trends, identify churn signals, and support product demand planning, with forecasts reviewed against available evidence.

Our Approach
We organize approved sales, website, and customer records into a reporting setup and review missing values, consistency, and historical coverage.
We build models to identify patterns and estimate future sales or customer trends, then evaluate them against held-out historical data and suitable baselines.
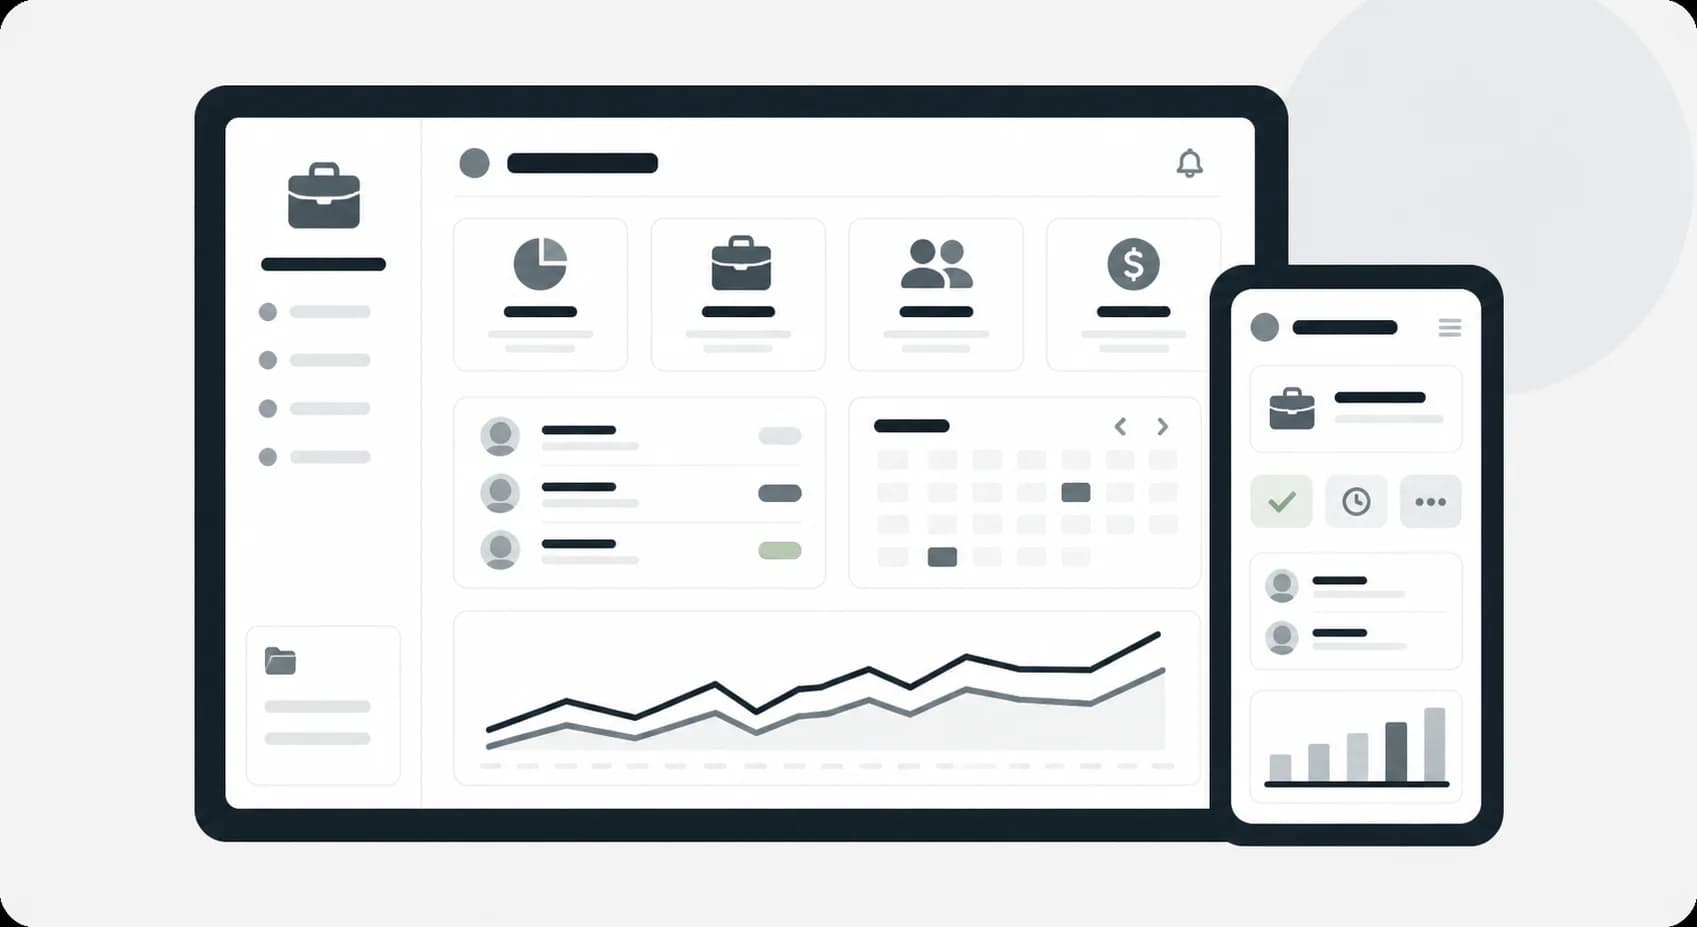
We present estimates, assumptions, and observed trends in a clear dashboard so you can review the evidence and plan next steps without digging through spreadsheets.
Where It Fits
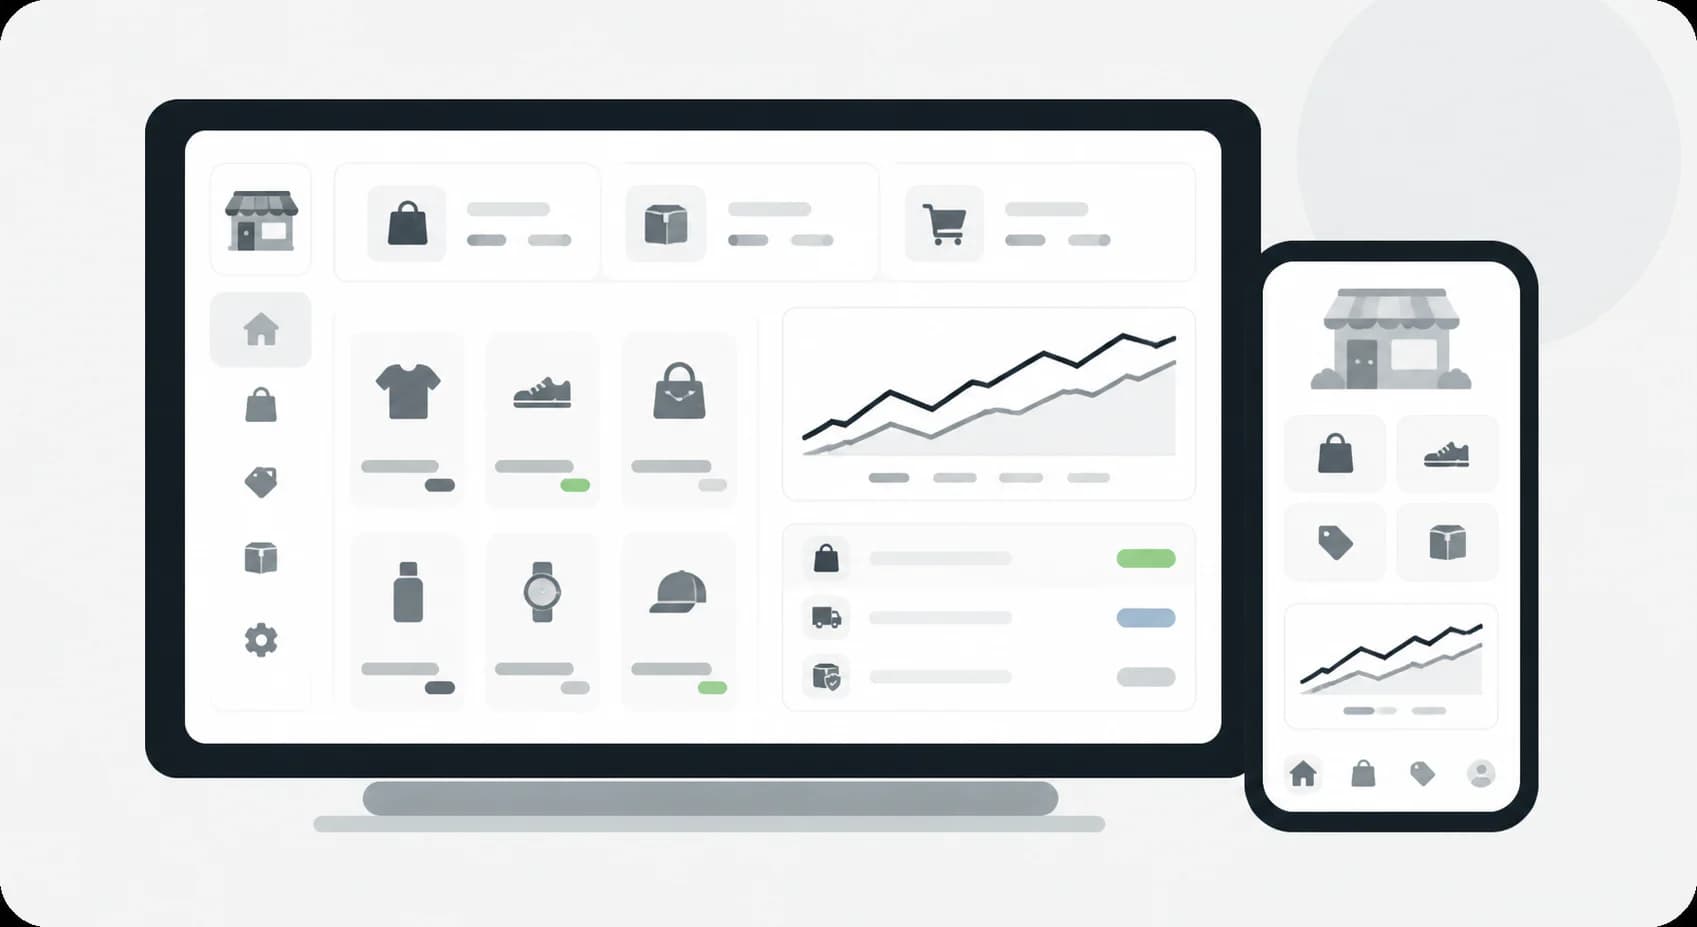
Estimating product demand and identifying customer groups with signals of repeat purchasing.
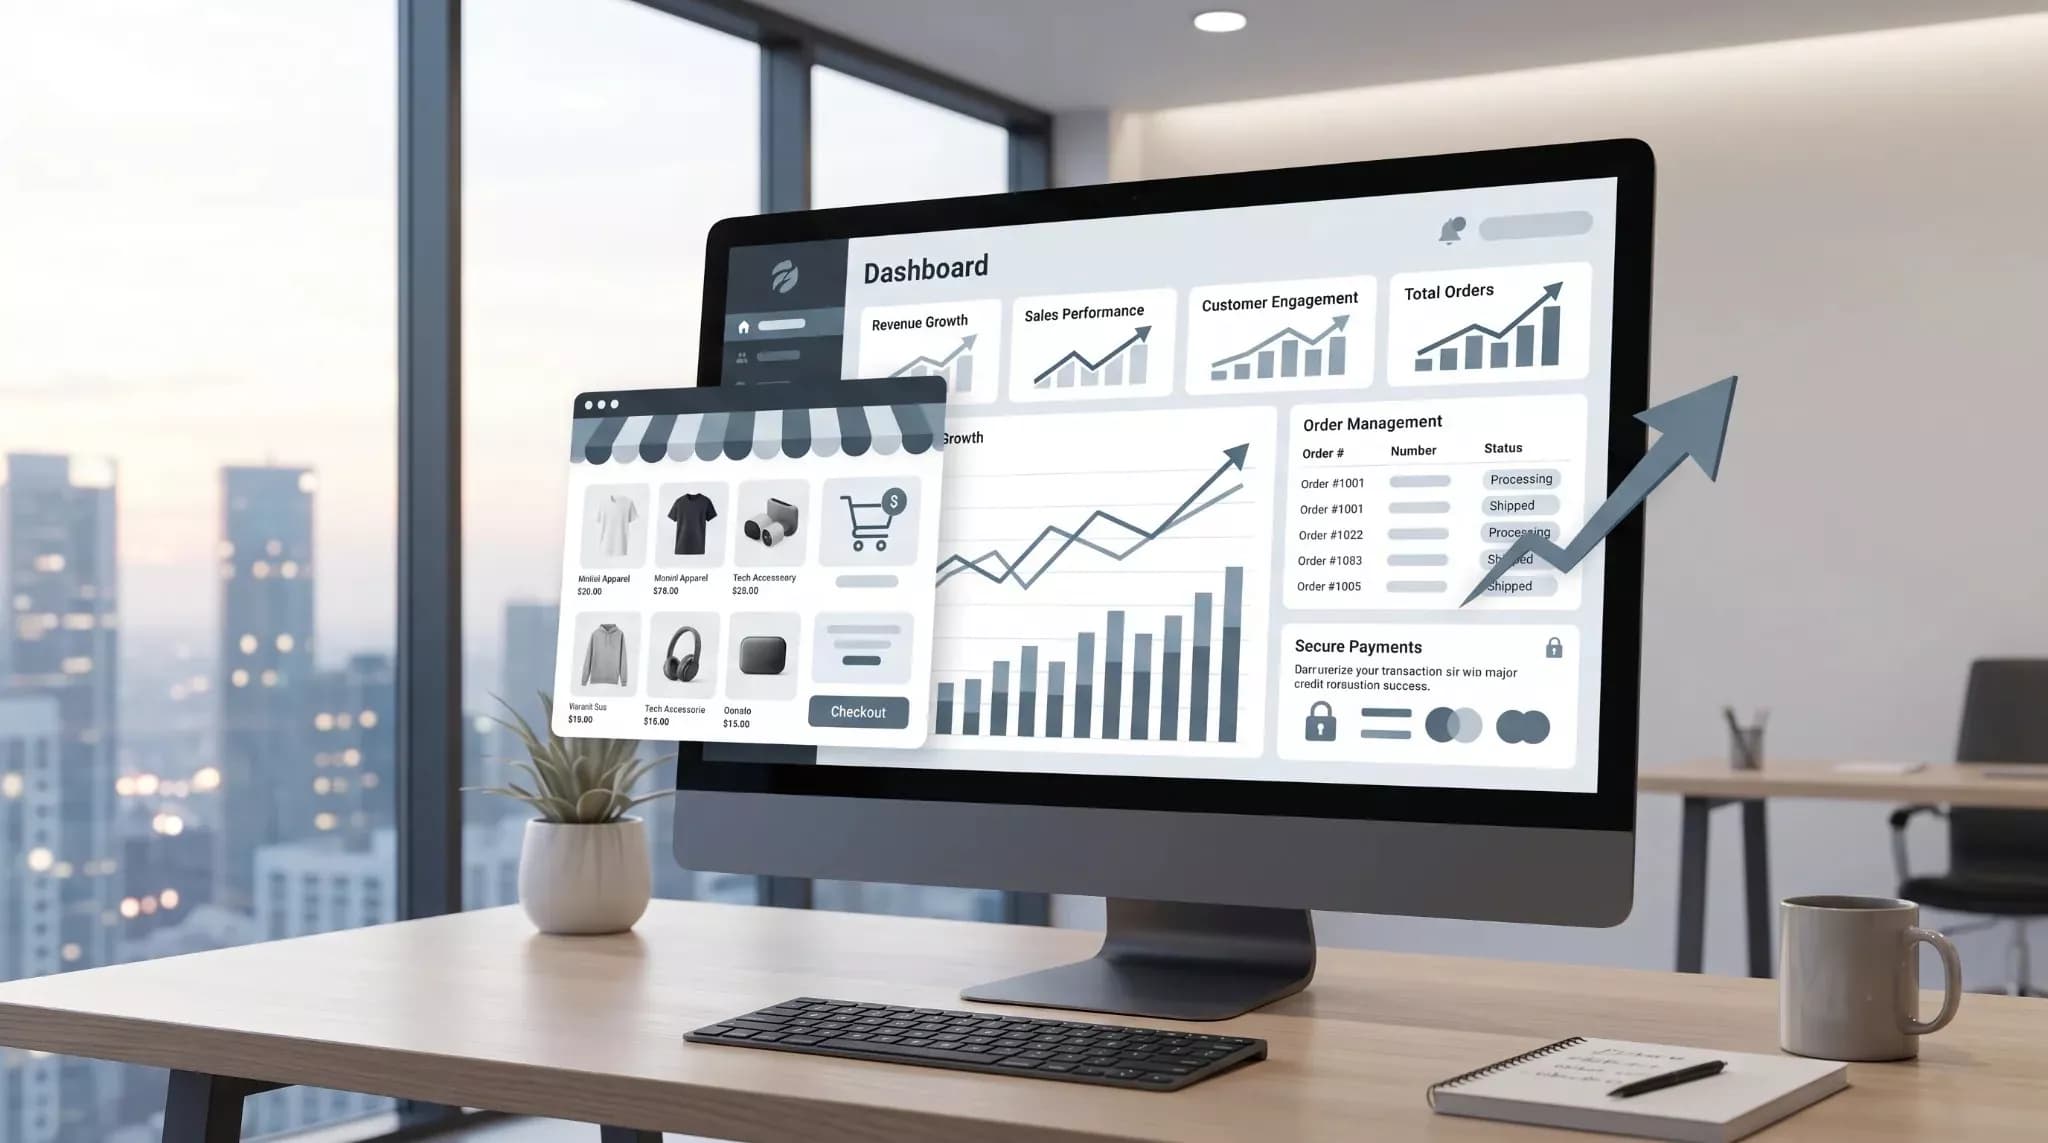
Identifying potential cancellation signals so your team can prioritize retention outreach.

Estimating staff workload and team availability using pipeline scenarios and historical delivery data.
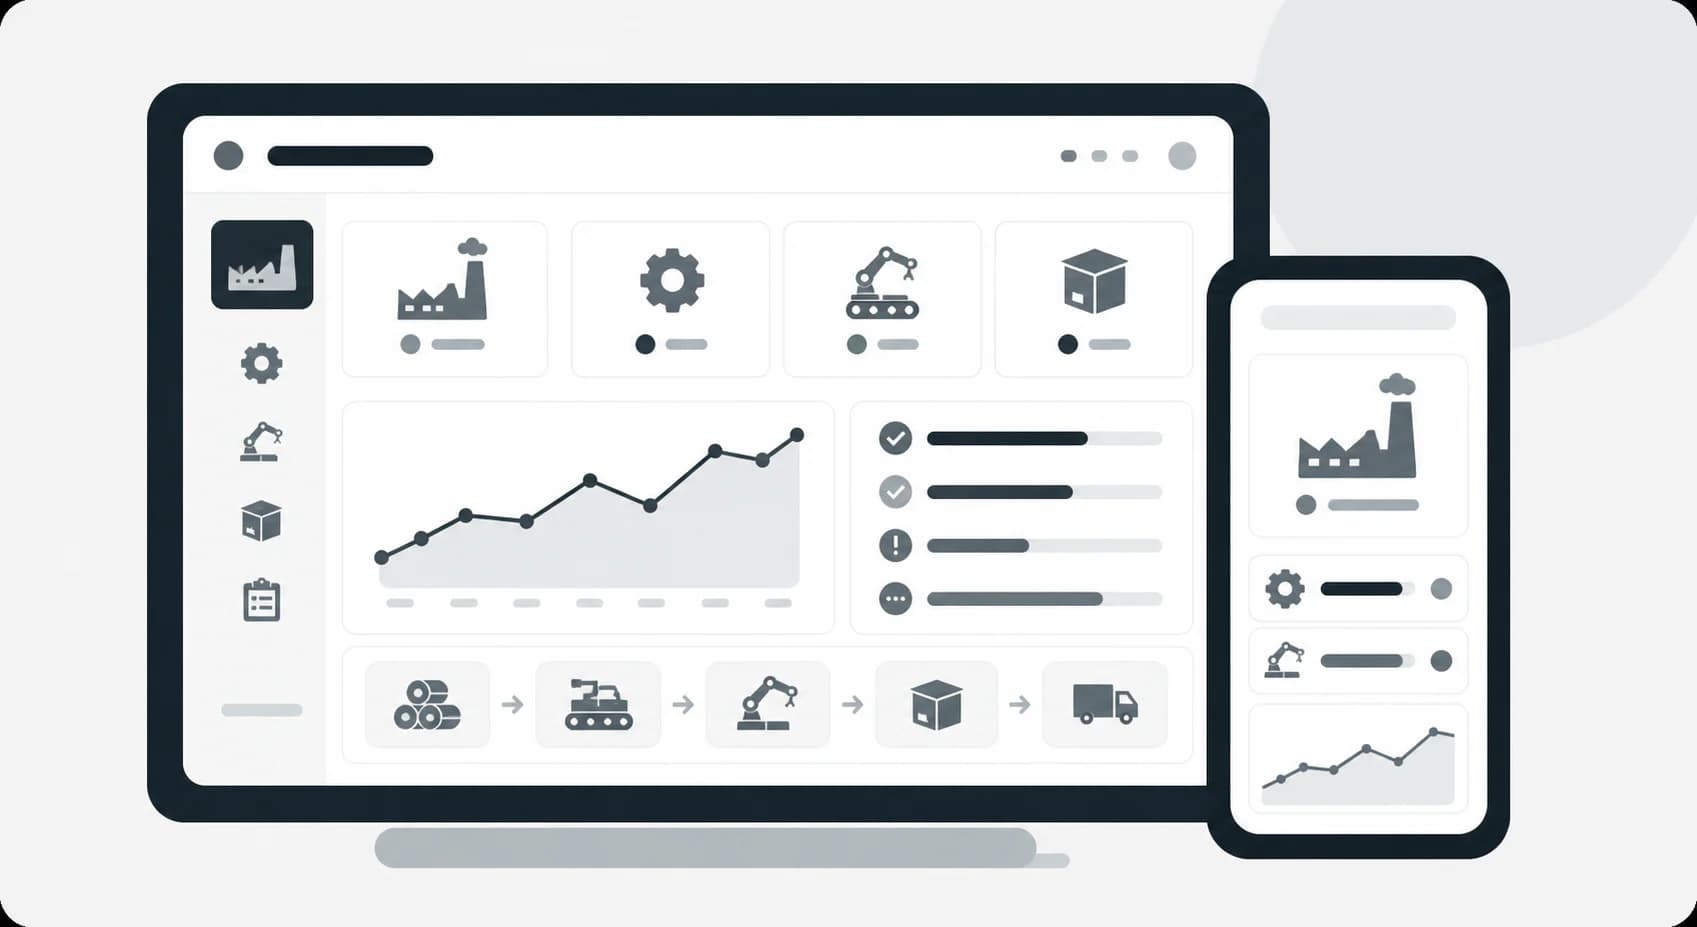
Estimating material needs and production demand using historical activity, lead times, and planning assumptions.
Analyzing regional demand and valuation trends where suitable historical data is available, with estimates subject to changing market conditions.

Estimating patient visit volumes to support staffing plans using appropriately permitted and protected operational data.
What We Help With
Estimating monthly and quarterly revenue using historical data, documented assumptions, and forecast evaluation.
Estimating restock needs and reviewing demand uncertainty to support inventory decisions and reduce shortage risk.
Identifying potential inactivity or cancellation signals so your team can review and prioritize re-engagement efforts.
Estimating customer value patterns to inform acquisition priorities, with assumptions and limitations made clear.
Analyzing associations between price changes, sales volume, and margins, accounting for available context and testing options.
Building clear chart dashboards with plain-language summaries and accessible labels alongside visual indicators.
Technology

Presenting approved reporting sources and forecast outputs in shared visual dashboards.

Organizing reporting views, business measures, and model outputs for review.

Preparing data, building forecasting workflows, and evaluating model performance.

Reviewing permitted website event data as an input to business reporting.
Explore More



Frequently Asked Questions
Predictive analytics uses historical business data, such as sales records and website activity, to identify patterns and estimate future outcomes. It can support inventory planning or customer analysis, but forecasts are uncertain and should be evaluated rather than treated as exact predictions.
Not necessarily. We first review data quality, history, frequency, and coverage for the question you want to answer. Some useful analyses can work with smaller datasets, while seasonal forecasts or rare customer behaviors may need more history. If the evidence is insufficient, we recommend improving collection or starting with descriptive reporting instead.
We design dashboards with clear charts, labeled indicators, and plain-language summaries so your team can understand the results. We explain the assumptions, uncertainty, and limitations behind forecasts and show your team how to use the reports for planning.
Start a Conversation